Chart Decoder Series: Rate of Change: How Traders Measure Momentum Behind A Move
The Bitfinex Chart Decoder Series explains how traders use the Rate of Change (ROC) indicator to assess momentum behind price moves, distinguishing genuine breakouts from false signals in Bitcoin’s recent price action.
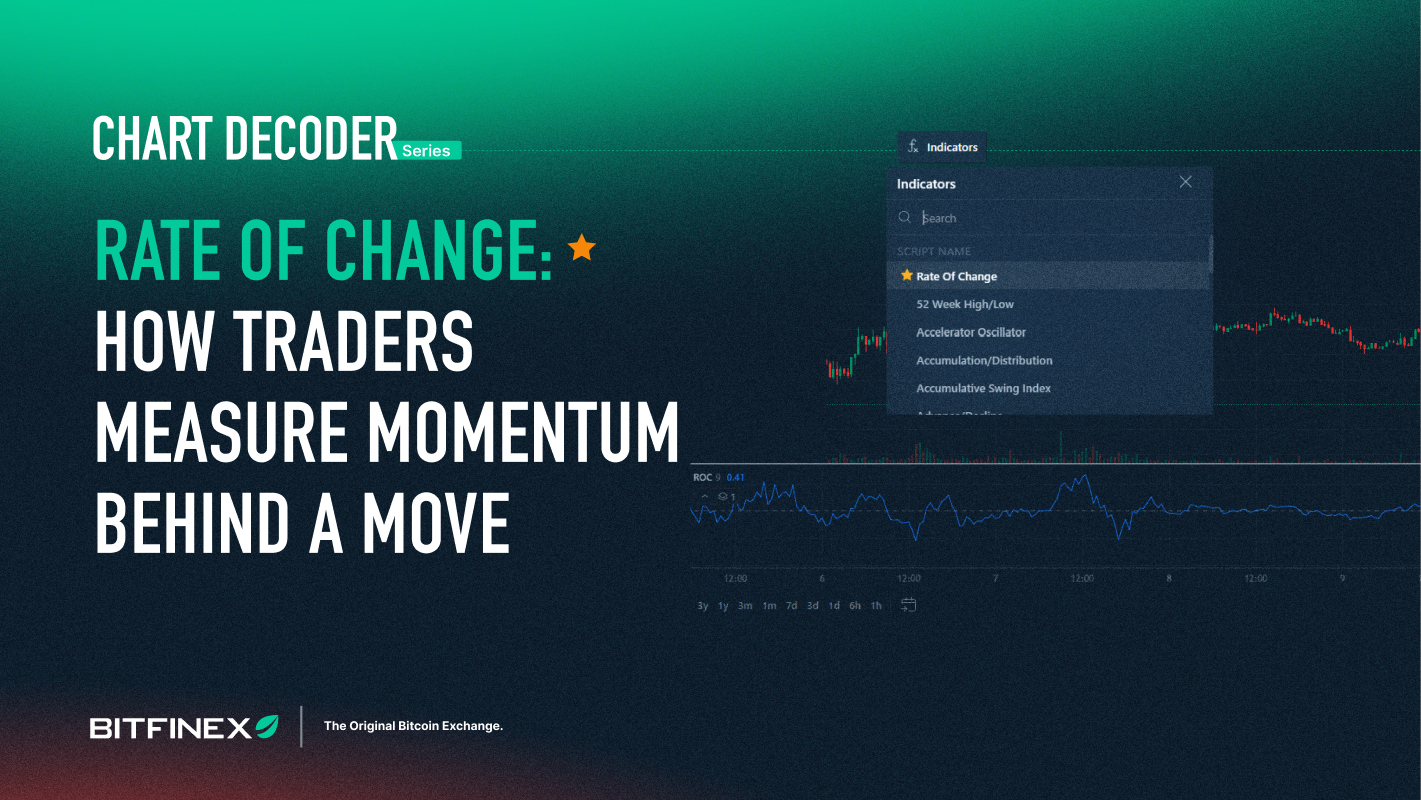
The Rate of Change (ROC) indicator measures the percentage change in price over a set period, helping traders evaluate whether a price move is gaining or losing momentum. On Bitfinex, the default setting compares the current price to the price 9 candles prior, with readings like +0.47% indicating a 0.47% increase over that span. Unlike bounded indicators, ROC has no fixed limits, making it useful for identifying accelerating or fading trends without directional bias.
Traders often combine ROC with other tools like RSI or MACD, as ROC alone cannot confirm trend direction or predict reversals. Shorter lookback periods react quickly but may produce noise, while longer periods smooth data but lag behind price changes. The indicator’s strength lies in spotting early shifts in momentum, such as when Bitcoin’s ROC repeatedly recovered above zero during its climb from $63,000 to $65,000 in August 2026, signaling sustained bullish pressure despite brief pullbacks.
As Bitcoin approached resistance near $65,000, the ROC began declining even as price held near highs, suggesting the uptrend’s pace was slowing. This weakening ROC did not confirm a reversal but served as an early warning that bullish momentum was cooling. Traders monitoring the 1-hour chart on August 6, 2026, noted this divergence, emphasizing the need to pair ROC with price structure for confirmation before acting on signals.
On the 15-minute chart the same day, Bitcoin’s price reached similar highs, but the ROC formed a lower high, indicating reduced buying pressure. This bearish divergence—where price rises while momentum falls—can precede a potential reversal, though it does not guarantee one. Traders use such signals to reassess positions, as ROC’s ability to highlight slowing momentum provides critical context beyond simple price levels.