Custom metrics are now supported in Vercel Observability
Vercel has introduced support for custom metrics in its Observability platform, allowing users to emit and analyze their own metrics from Vercel Functions alongside built-in data.
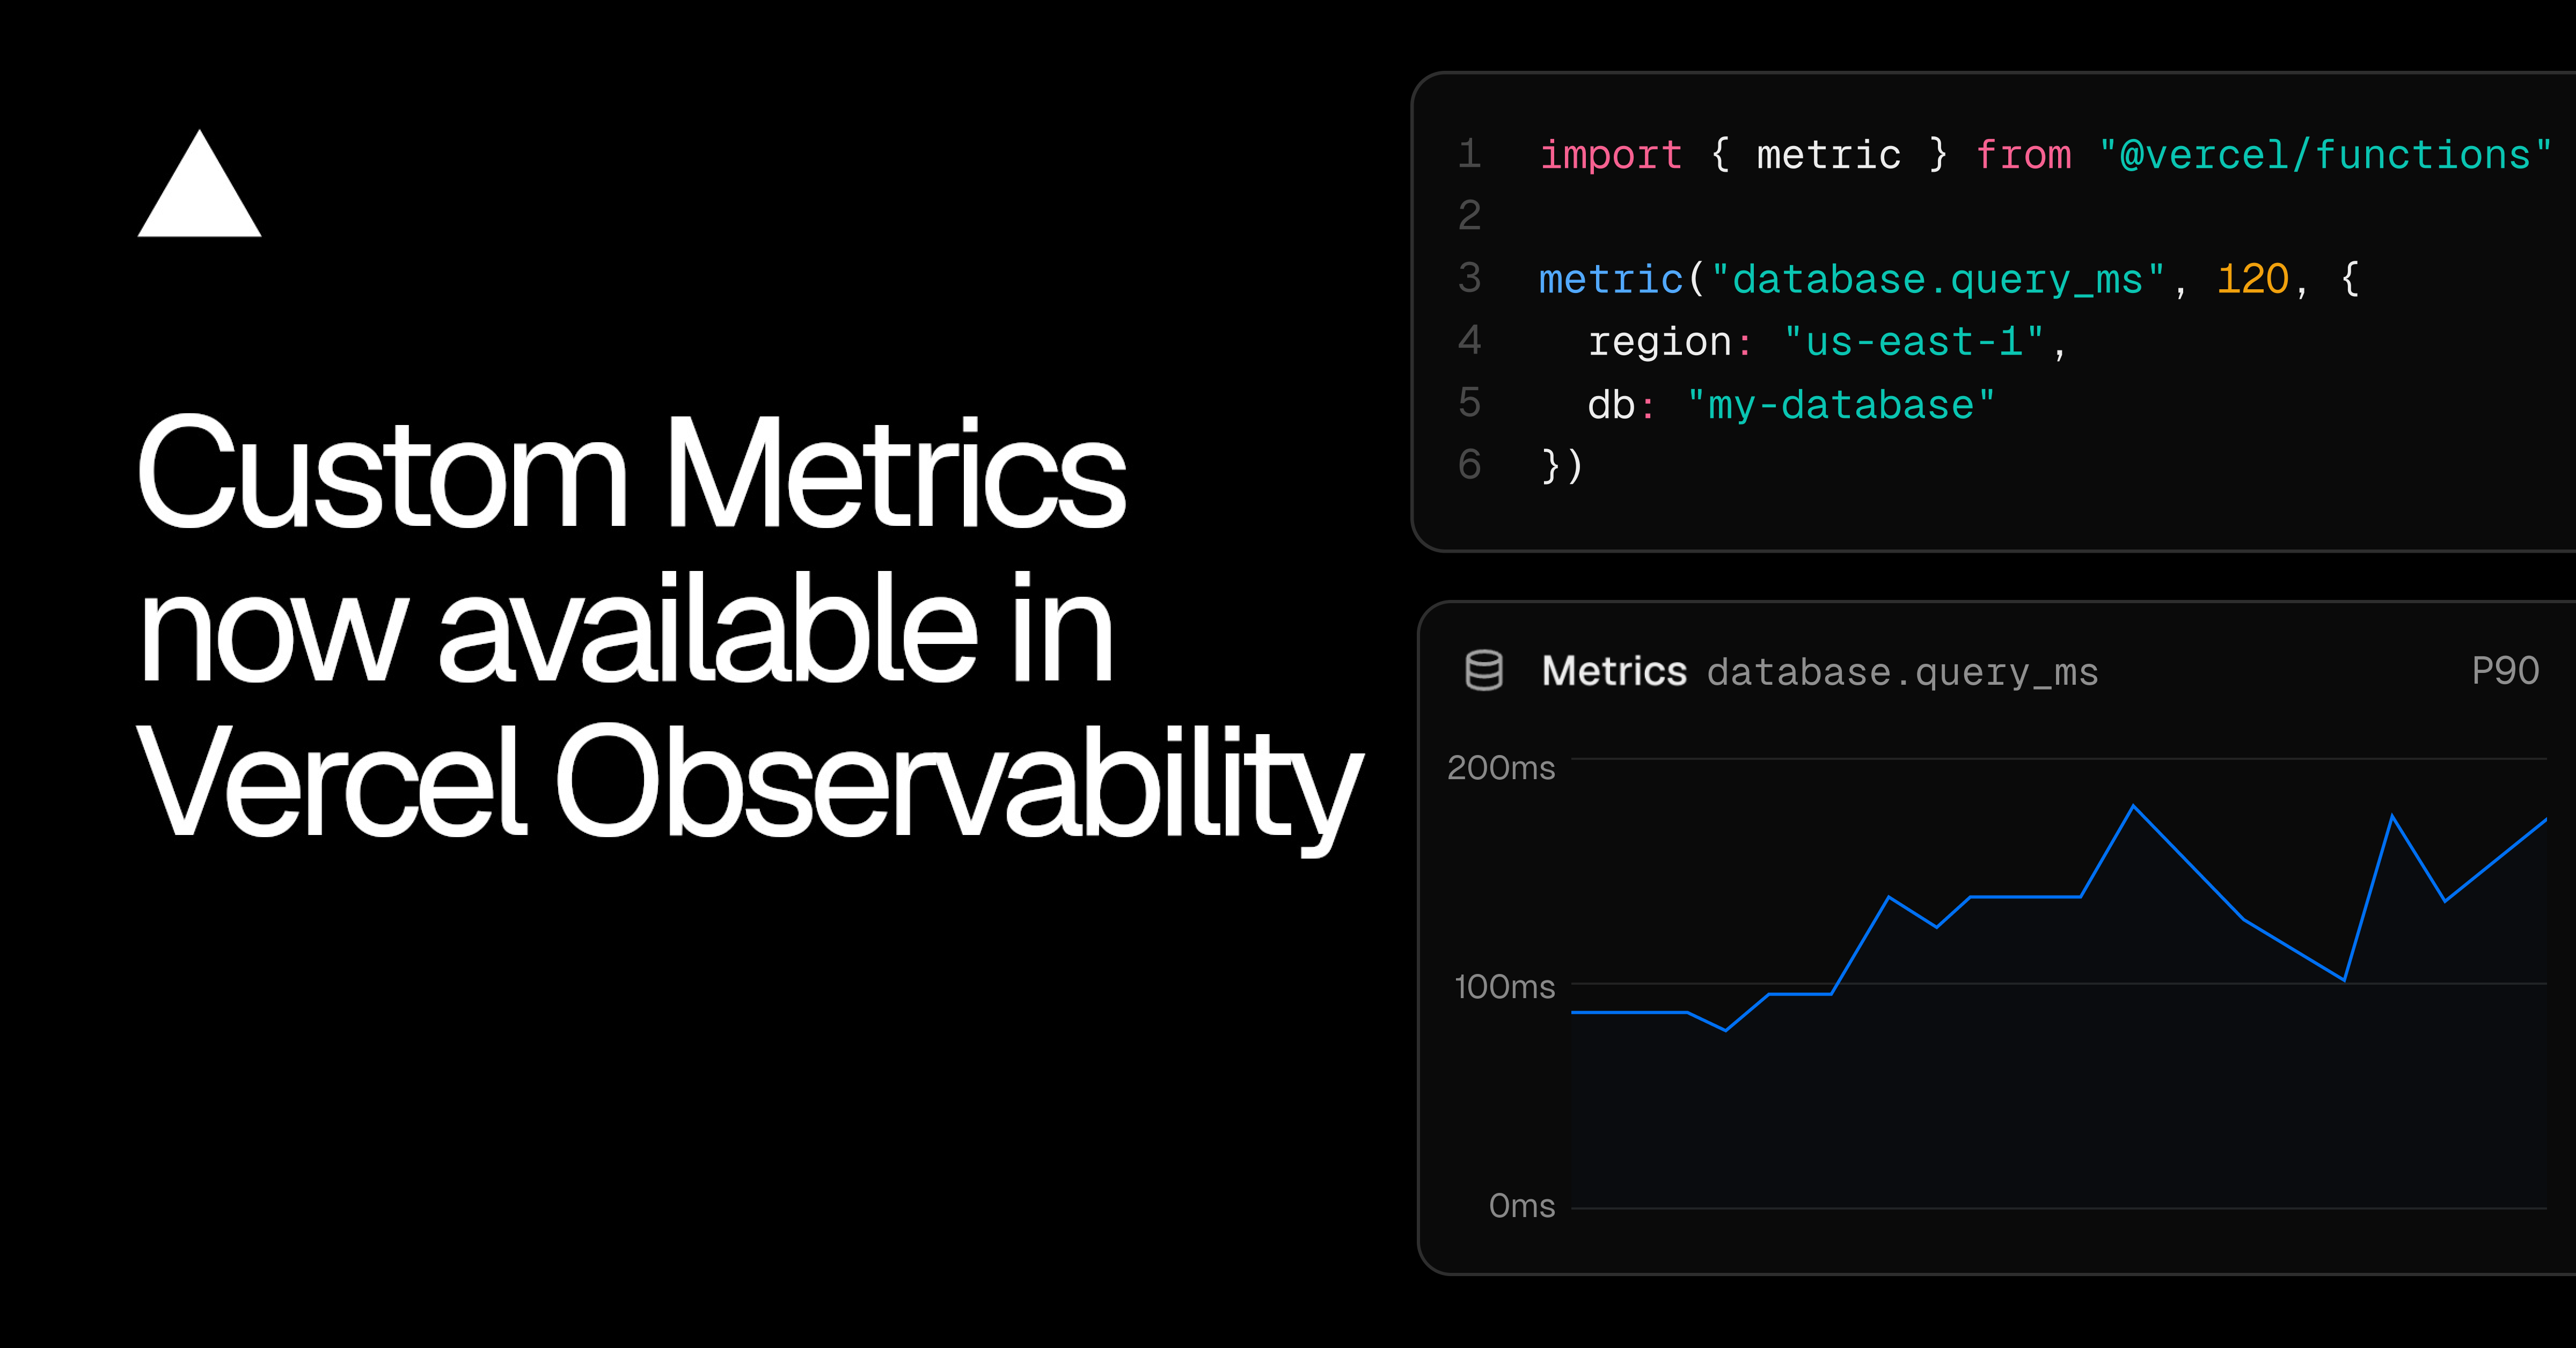
Vercel now enables users to record custom metrics directly from Vercel Functions using the metric() function from the @vercel/functions package. This allows developers to track specific values such as request latency or business events. The metrics can be enriched with attributes to facilitate filtering and grouping, providing more granular insights into application performance and behavior.
Once emitted, these custom metrics integrate seamlessly with Vercel’s Observability platform. Users can leverage the query builder to slice and aggregate metrics in real time, create and share dashboards within Notebooks, or query metrics via the CLI using the vc metrics command. This integration ensures that custom data is accessible alongside Vercel’s built-in observability metrics.
Vercel automatically appends useful attributes to custom metrics, including the source deployment and function region. These attributes enhance the ability to segment and analyze data, making it easier to identify patterns or anomalies tied to specific deployments or geographic regions.
Custom metrics are billed as observability events and are available to users on Pro and Enterprise plans with Observability Plus. This feature expands the platform’s capabilities, allowing teams to tailor monitoring to their specific needs while maintaining consistency with Vercel’s existing observability tools.