Vercel Sandbox now supports memory observability
Vercel Sandbox now provides memory usage metrics in its observability tools, enabling developers to monitor sandbox performance through dashboards, CLI commands, and custom queries.
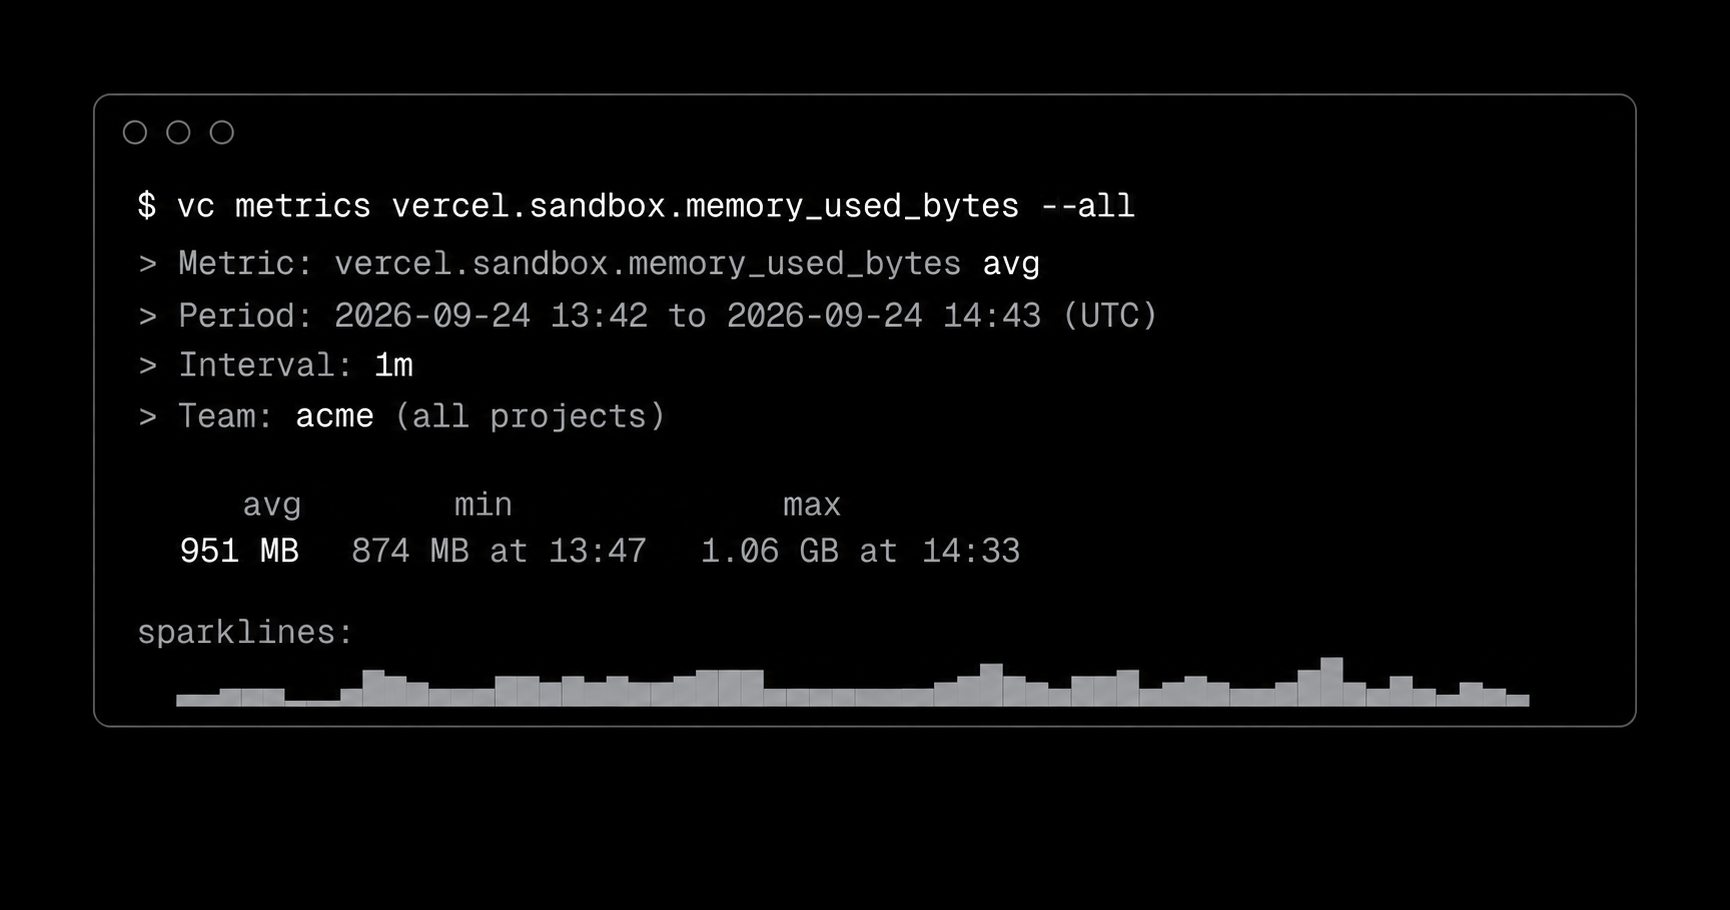
Vercel has expanded its Sandbox observability features to include memory usage tracking, complementing existing CPU and data transfer metrics. The update introduces a Memory Usage card in the dashboard, displaying average, P75, and P95 memory consumption across sandboxes. This data is also accessible via the Vercel CLI using the vercel metrics command, offering flexibility for developers to retrieve insights directly from their workflows.
The sandbox detail page now includes charts that visualize memory usage relative to each sandbox’s memory ceiling, helping users identify potential performance bottlenecks. This feature provides a clearer picture of resource constraints, allowing for more informed debugging and optimization decisions. The memory data is integrated alongside existing observability metrics, maintaining consistency with how other performance indicators are presented.
Developers can now build custom queries against the new memoryUsedBytes measure in the Observability query builder, enabling tailored monitoring and alerting. This addition allows teams to set up automated alerts based on memory thresholds, ensuring proactive responses to resource-intensive operations. The query builder’s integration with sandbox usage events streamlines the process of extracting actionable insights from memory data.
The memory usage metrics are also available through the Vercel CLI, accessible via the vercel metrics command with the vercel.sandbox.memory_used_bytes flag. Users can run the command in a linked project to view project-specific memory data or use the --all flag to aggregate insights across all team projects. This CLI support enhances the tool’s utility for developers who prefer command-line interfaces for monitoring and troubleshooting.